
Property appreciation is the increase in a property's market value over time, and it's one of the most powerful forces working in your favor as a homeowner or investor. Understanding it puts you in control of smarter decisions, whether you're planning to sell, refinance, or renovate.
- For owners: appreciation builds equity you can borrow against or cash out when you sell.
- Two main causes: market forces (organic appreciation) and property improvements (forced appreciation).
- Your first move: check recent comparable sales in your neighborhood to see where your home stands today.
Table of Contents
- What is property appreciation and how does it work?
- Natural vs. forced appreciation: what's the difference?
- How to calculate your home's appreciation rate
- What actually drives property values up or down?
- How do national appreciation rates compare to Southern California?
- Which home improvements create the most forced appreciation?
- How appreciation affects you as a homeowner
- When can appreciation stall or reverse?
- What should you do next?
- Key Takeaways
- A Southern California perspective worth considering
- Ready to see what your home is worth in today's market?
- Useful sources and further reading
What is property appreciation and how does it work?
At its core, appreciation means your property is worth more than you paid for it. That gain can be nominal (the raw dollar increase) or real (adjusted for inflation). The distinction matters for investors comparing real estate to other assets: a home that rises 3% per year while inflation runs at 3% has delivered zero real growth, even though the dollar figure looks positive. When estimating real capital growth, always compute both to understand what you've actually gained in purchasing power.
Here's a simple example. You buy a home for $500,000. Five years later, comparable sales put its value at $620,000.
- Total appreciation: $620,000 − $500,000 = $120,000
- Percent appreciation: ($120,000 / $500,000) × 100 = 24%
To estimate current value, agents and appraisers pull data from the MLS, recent neighborhood comps, and formal appraisal reports. Each source has limits: MLS data can lag by weeks, and automated online estimates often miss property-specific features that add or subtract value.
Natural vs. forced appreciation: what's the difference?

Appreciation splits into two types: organic (market-driven) and forced (owner-driven). Knowing which type applies to your situation shapes your entire strategy.
| Factor | Natural (Organic) Appreciation | Forced Appreciation |
|---|---|---|
| Cause | Market demand, inflation, job growth, low supply | Renovations, additions, upgrades |
| Timeline | Years to decades | Months to a year |
| Predictability | Low — tied to economic cycles | Moderate — tied to project quality and local comps |
| ROI drivers | Location, population growth, interest rates | Kitchen/bath modernization, ADUs, curb appeal |
| Best for | Long-term buy-and-hold owners | Investors, fix-and-flip, value-add buyers |
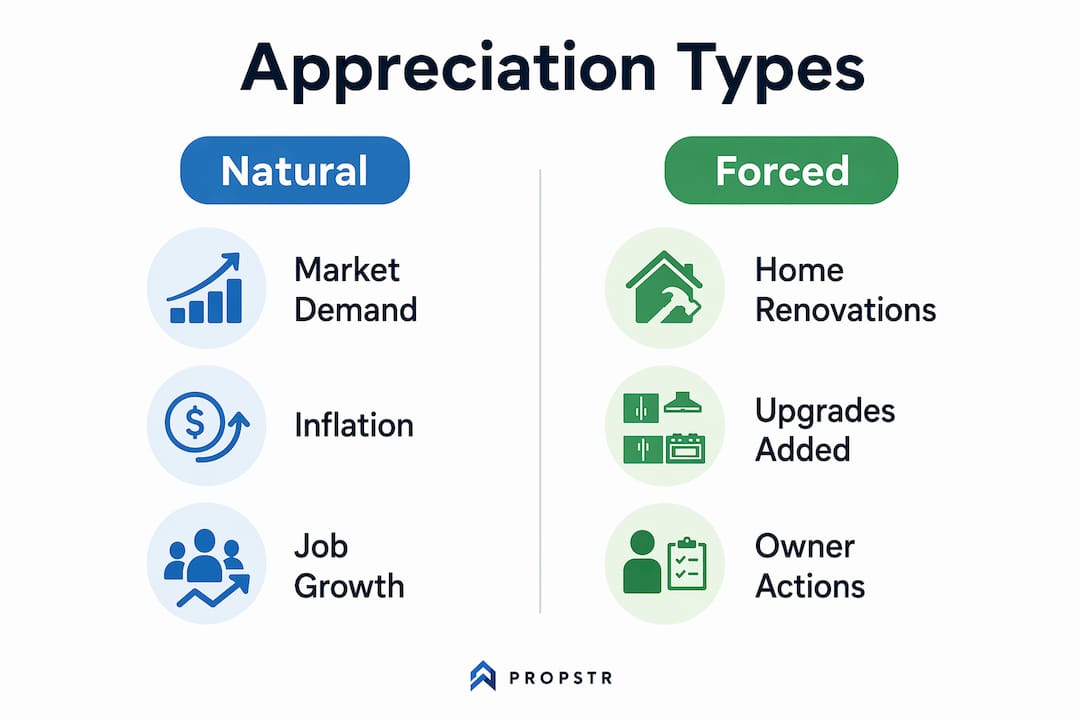
Natural appreciation is largely outside your control. Forced appreciation is where you have real agency. Buying a distressed property and upgrading it can create value faster than waiting years for the market to move on its own.
Pro Tip: Time your renovations to local market cycles. If comps in your neighborhood are rising, a kitchen upgrade before listing can amplify gains. If the market is softening, the same project may not recoup its cost. Talk to a local agent before committing to a large project.
How to calculate your home's appreciation rate
The simple percent-change formula gives you total appreciation; annualizing it lets you compare across different holding periods.
Simple appreciation:
Total appreciation = Current Value − Purchase Price Percent appreciation = (Total Appreciation / Purchase Price) × 100
Annualized appreciation (CAGR):
Annualized Rate = [(Current Value / Purchase Price)^(1/Years)] − 1
Annualizing returns matters because a 24% gain over 5 years is very different from a 24% gain over 2 years. Without annualizing, you can't compare your home's performance to other investments on an apples-to-apples basis.
Worked example: You bought at $500,000 and the home is now worth $620,000 after 5 years.
- Simple gain: 24% (as above)
- Annualized: [(620,000 / 500,000)^(1/5)] − 1 = (1.24)^0.2 − 1 ≈ 4.4% per year
For reliable current-value inputs, use 3–5 recent local comps from the MLS, a professional appraisal, or a formal comparative market analysis from a licensed agent. Automated valuation tools are a useful starting point but can carry significant error margins in neighborhoods with limited recent sales.
What actually drives property values up or down?
Appreciation doesn't happen randomly. Specific macro and local forces push values in predictable directions, and understanding them helps you assess any property's prospects.
Macro drivers:
- Job and income growth: Markets with expanding employment attract buyers, increasing demand and prices.
- Population growth: More people competing for limited housing stock pushes values up.
- Inflation: Rising construction costs and general price levels lift replacement values and, over time, home prices.
- Interest rates: Lower rates expand buyer purchasing power and heat up demand; higher rates cool it.
- National economic health: Recessions reduce buyer confidence and can stall or reverse appreciation.
Local drivers:
- Supply constraints: Limited buildable land and slow permitting keep inventory tight and prices elevated.
- School district quality: Homes in top-rated districts consistently command premiums.
- Transit access: Proximity to rail, freeways, and employment hubs adds measurable value.
- Neighborhood investment: New retail, parks, and infrastructure signal rising desirability.
- The lock-in effect: Homeowners with low-rate mortgages are reluctant to sell and take on a higher rate, which reduces supply turnover and sustains upward price pressure even as rates rise. This dynamic is especially pronounced in Southern California, where many owners locked in rates well below current market levels.
Understanding local market trends in SoCal real estate is one of the most reliable ways to anticipate where appreciation is headed in a specific neighborhood.
How do national appreciation rates compare to Southern California?

National indexes like the FHFA House Price Index and Case-Shiller measure broad trends across hundreds of markets. They're useful for spotting national cycles, but they can mask enormous local variation. A market like Southern California regularly outpaces national medians by a wide margin.
| Market | Median Sales Price |
|---|---|
| Southern California | $812,000 |
| National median | $365,000 |
That 122% premium reflects a combination of factors: constrained coastal geography, a "sunshine premium" tied to climate desirability, strong job markets in tech and entertainment, and the lock-in effect limiting available inventory.
SoCal appreciation also carries real headwinds. Wildfire risk, drought, and rising insurance costs are negative modifiers that appraisers weigh carefully, particularly in hillside and inland communities. These environmental factors can suppress appreciation or make properties harder to finance.
Key takeaways for interpreting appreciation data:
- National averages rarely reflect what's happening on your street.
- Local MLS comps and recent sales are far more accurate for a single property than any national index.
- Always verify figures with a local agent or appraiser who knows your specific submarket.
Which home improvements create the most forced appreciation?
Targeted improvements reliably create forced appreciation when they align with what buyers in your local market actually want. The key word is "align" — over-improving for your neighborhood rarely pays back.
- Curb appeal (landscaping, exterior paint, front door): First impressions drive offers. Buyers form opinions before they walk through the door, and strong curb appeal can lift perceived value meaningfully.
- Kitchen modernization: Updated kitchens consistently rank among the highest-return improvements for resale. Even a mid-range refresh (new countertops, cabinet fronts, appliances) can outperform a full gut renovation in many markets.
- Bathroom updates: Similar logic applies. Clean, modern baths signal well-maintained homes and justify higher offers.
- Accessory Dwelling Units (ADUs): In California, ADUs add rentable square footage and are priced by appraisers as income-producing assets. They're one of the most effective value-add plays in SoCal right now.
- Energy-efficient upgrades (solar, insulation, windows): Buyers increasingly price in utility costs. Energy upgrades can be positive appraisal modifiers in markets where they align with local demand, which SoCal increasingly is.
For investors, buying distressed properties and upgrading them is a proven way to generate appreciation faster than waiting for organic market moves. Check out ways to boost home offers for a practical list of tactics that work in the Southern California market.
Pro Tip: Before any major project, pull 3–5 recent comps of upgraded homes in your neighborhood. If updated kitchens aren't moving the needle on sale prices locally, a $60,000 remodel won't either. A 30-minute conversation with a local agent before you start can save you from a costly mismatch.
How appreciation affects you as a homeowner
Appreciation increases your home equity and borrowing power, but it also triggers planning considerations you'll want to think through before you sell or refinance.
- Equity buildup: Every dollar of appreciation adds directly to your net worth. If your $500,000 home rises to $620,000, you've gained $120,000 in equity without making a single extra payment.
- Refinancing and HELOCs: Higher equity opens access to cash-out refinancing or a home equity line of credit, which many owners use for renovations, debt consolidation, or investment. Understanding how leverage interacts with appreciation can significantly amplify your overall returns.
- Selling profit: Appreciation is what turns a home sale into a financial win. Your net proceeds depend on your appreciated value minus your remaining mortgage, selling costs, and any capital gains tax owed.
- Capital gains basics: The IRS allows most homeowners to exclude up to $250,000 in gains ($500,000 for married couples filing jointly) from a primary residence sale, subject to ownership and use tests. Gains above those thresholds are taxable.
- Property taxes: In many states, assessed value rises with appreciation, which can increase your annual tax bill over time.
- Investor cash flow: For rental property owners, appreciation affects both the asset's resale value and the equity available for future acquisitions. Proactive property management preserves the condition that supports that value.
This article is general information, not tax or legal advice. Consult a qualified tax professional for guidance specific to your situation.
When can appreciation stall or reverse?
Appreciation is not guaranteed. Several identifiable forces can slow, stop, or reverse property value growth, and planning around them is part of any sound real estate strategy.
- Market downturns: Economic recessions reduce buyer demand and can push prices down significantly, as seen in 2008–2009.
- Oversupply: When new construction outpaces demand, inventory rises and prices soften.
- Rising interest rates: Higher rates reduce affordability, shrinking the buyer pool and cooling price growth.
- Environmental risks: Flood zones, wildfire-prone areas, and drought-affected regions face insurance challenges and buyer hesitation that suppress values.
- Deferred maintenance: A neglected property depreciates relative to well-maintained comps, even in a rising market.
- Policy changes: Zoning shifts, rent control expansion, or changes to tax treatment can alter a property's income potential and market value.
Pro Tip: Mitigation starts with due diligence. Review FEMA flood maps, local wildfire risk scores, and insurance availability before buying. For investors holding multiple properties, diversifying your real estate portfolio across different markets and property types reduces exposure to any single risk factor.
What should you do next?
Appreciation matters because it's the engine behind long-term wealth building in real estate, and knowing how to measure and influence it puts you ahead of most owners.
- Check your local comps. Pull 3–5 recent sales of similar homes in your neighborhood from the MLS or ask an agent for a comparative market analysis.
- Run the numbers. Use the simple percent-change formula and the CAGR formula above to estimate your home's total and annualized appreciation since purchase.
- Contact an agent or appraiser. For a refinance, sale, or major renovation decision, a professional home valuation gives you the most accurate current-value estimate and local context.
Local knowledge is what turns a national trend into a number that actually applies to your home.
Key Takeaways
Property appreciation is the increase in a home's market value over time, driven by market forces, property improvements, or both, and measuring it accurately requires local comps, not just national averages.
| Point | Details |
|---|---|
| Two types of appreciation | Organic (market-driven) and forced (owner-driven improvements) serve different strategies and timelines. |
| Simple calculation | Subtract purchase price from current value, then divide by purchase price and multiply by 100 for percent gain. |
| Annualize for accuracy | Use CAGR to compare multi-year holds fairly: [(Current Value / Purchase Price)^(1/Years)] − 1. |
| SoCal commands a premium | Southern California's median of $812,000 runs 122% above the national median of $365,000, driven by supply constraints and climate desirability. |
| Increaltors for local insight | Increaltors provides personalized home valuations and local market snapshots for Los Angeles, Orange County, and surrounding Southern California communities. |
A Southern California perspective worth considering
Most people think of appreciation as something that just happens to them. The market goes up, their home is worth more, and they feel good about it. What they miss is how much of that outcome is actually within their control, and how much the specific submarket they're in shapes the ceiling.
In Southern California, the lock-in effect is one of the most underappreciated forces in the current market. Owners who refinanced at 3% aren't selling into a 7% rate environment, which means inventory stays thin and prices stay supported even when buyer demand softens. That's not a national story. It's a hyper-local one, and it plays out differently in Pasadena than it does in Riverside.
The other thing most guides skip is that environmental risk is not a future concern in SoCal. It's a present pricing factor. Wildfire exposure, insurance availability, and proximity to flood zones are already showing up in appraisal adjustments and buyer negotiations. Owners who understand this can make smarter decisions about where to invest in improvements and where to be cautious.
If you want a clear picture of where your specific property stands, a local market snapshot is the most honest starting point.
Ready to see what your home is worth in today's market?
Increaltors specializes in personalized home valuations and real estate guidance across Los Angeles, Orange County, and the surrounding Southern California communities. Rather than relying on a national estimate that may be off by tens of thousands of dollars, you get a local market snapshot built from actual comparable sales in your neighborhood.

Whether you're thinking about selling, refinancing, or simply want to know where you stand, the team at Increaltors can walk you through current comps, local appreciation trends, and your options. Browse current listings to see what comparable homes are selling for, or request your free home valuation to get a personalized estimate. Your next smart real estate decision starts with knowing your number.
Useful sources and further reading
Verify any figures with a local MLS search or a licensed appraiser before making financial decisions based on them.
- FHFA House Price Index (FHFA HPI): The most comprehensive national index for tracking single-family home price changes across all 50 states and over 400 cities, with data going back to the mid-1970s.
- Case-Shiller Home Price Index (S&P Global): Widely cited repeat-sales index covering major metro areas; useful for tracking broad price trends.
- BiggerPockets: What Is Appreciation in Real Estate?: Investor-focused breakdown of organic vs. forced appreciation with practical examples.
- Rocket Mortgage: Home Appreciation Guide: Clear explanation of calculation methods, including annualized returns.
- West Coast Evaluation: SoCal Home Values: Appraiser-level analysis of the seven factors most affecting Southern California valuations.
- Increaltors Home Valuation Tool: Request a free local market report and comparable sales analysis for your Southern California property.