
TL;DR:
- Most investors in Temecula focus solely on cash flow, undervaluing appreciation, principal paydown, and tax benefits for total returns.
- A comprehensive ROI analysis considers these drivers, with leverage amplifying overall wealth building in the long run.
Temecula has built a reputation as one of Southern California's most attractive markets for rental investors, but most guides stop at cash flow and leave you with an incomplete picture. If you've been evaluating a Temecula property purely on monthly rent versus mortgage payment, you're likely undervaluing your actual returns and possibly passing on deals that would build serious wealth over time. This guide cuts through that confusion, walking you through ROI frameworks, 2026 market data, rental strategy comparisons, and the advanced drivers that separate good investments from great ones in this specific market.
Table of Contents
- Understanding ROI and cap rate: Essential formulas for Temecula
- Temecula market outlook: Appreciation, affordability, and returns in 2026
- Comparing property types and rental strategies: Long-term vs. short-term yields
- Nuances and advanced ROI drivers: Appreciation, leverage, and principal paydown
- The overlooked reality: Why Temecula ROI depends on more than cash flow
- Find your next high-ROI Temecula property with expert local guidance
- Frequently asked questions
Key Takeaways
| Point | Details |
|---|---|
| ROI benchmarks | Temecula investors typically target 7–11% ROI and 3.2–4.0% cap rates. |
| Macro drivers | California's rising home prices and improved affordability shape local returns. |
| STR nuances | Short-term rentals in Temecula offer strong revenue, but seasonal and expense factors impact ROI. |
| Total vs. income return | Total returns often rely more on appreciation and principal paydown than cash flow alone. |
| Next steps | Connect with a local real estate pro for ROI-driven property selection and advice. |
Understanding ROI and cap rate: Essential formulas for Temecula
Now that we've established the importance of accurate ROI measurement, let's break down the core formulas and what they reveal about the Temecula market.
ROI and cap rate are two of the most used terms in real estate investing, yet they measure very different things. ROI (return on investment) tells you how much profit you made relative to the money you put in. Cap rate (capitalization rate) tells you how a property performs independent of financing. Both matter, but neither alone gives you the full picture.
The standard ROI calculation methods break down like this:
ROI = (Annual Rental Income − Annual Expenses) ÷ Total Cash Invested
Cap Rate = Net Operating Income (NOI) ÷ Property Value
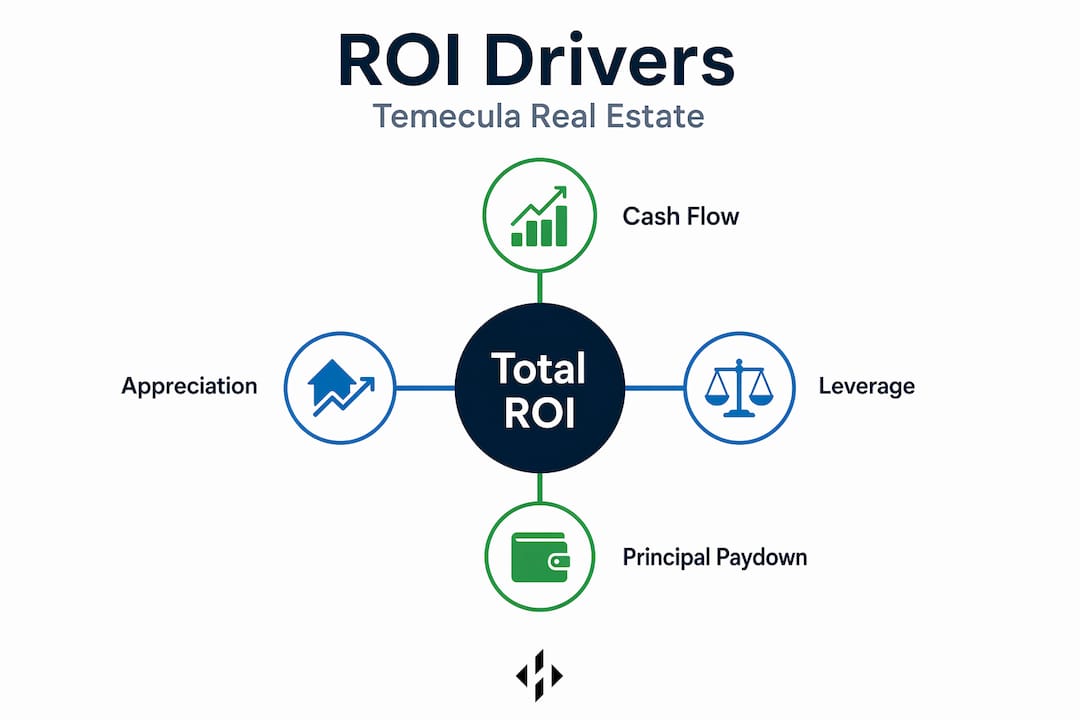
According to rental-property ROI research, these metrics are typically decomposed into four components: cash flow, appreciation, principal paydown, and tax benefits for leveraged investors. Focusing only on cash flow means you're missing three out of four return drivers. That's a significant blind spot.
The four components of real estate ROI
Here's a breakdown of what actually builds your return in Temecula:
- Cash flow: Monthly rent minus operating expenses (mortgage, insurance, taxes, maintenance, vacancy). This is what most people focus on exclusively.
- Appreciation: As property values rise, so does your equity. In a market like Temecula, this has historically been a major return driver.
- Principal paydown: Every mortgage payment your tenant effectively makes reduces your loan balance, building equity silently in the background.
- Tax benefits: Depreciation deductions, mortgage interest write-offs, and 1031 exchange opportunities can significantly reduce your taxable income.
Cap rate vs. cash-on-cash return
These two metrics often get confused. Cap rate ignores financing entirely, so it's useful for comparing properties on equal footing. Cash-on-cash return accounts for your actual mortgage payment and measures the yield on the dollars you personally invested. Both are valuable, but they answer different questions.
| Metric | What it measures | Financing included? |
|---|---|---|
| Cap rate | Property income efficiency | No |
| Cash-on-cash return | Return on actual cash invested | Yes |
| Total ROI | All return components combined | Yes |
| Gross yield | Revenue before expenses as % of price | No |
For Temecula specifically, cap rates generally fall in the 3.2% to 4.0% range, with total ROI averaging 7% to 11% when you account for all four components. That gap between cap rate and total ROI is where most of the real wealth gets created.
Pro Tip: Always distinguish between NOI (net operating income, which excludes mortgage payments) and gross cash flow (total rent collected). Lenders and appraisers use NOI. Your bank account uses net cash flow after debt service. Mixing them up leads to dangerously optimistic projections.
Understanding leverage and principal reduction is also essential because financing amplifies your ROI in ways that all-cash calculations completely hide.
Temecula market outlook: Appreciation, affordability, and returns in 2026
With foundational ROI formulas in hand, let's look at how Temecula's market climate in 2026 shapes expected returns and investment strategy.

California's housing market is entering 2026 with renewed momentum, and Temecula is positioned to benefit from several key macro trends. The C.A.R. 2026 Housing Market Forecast projects 2026 existing single-family home sales at 274,400 units, up 2% versus projected 2025 figures. More importantly for investors, the statewide median home price is forecast to rise 3.6% to $905,000, and housing affordability is expected to improve to 18% of households qualifying for a median-priced home, up from 17% in 2025.
That affordability improvement might sound modest, but it translates directly into more active buyers in the market, which supports both home prices and rental demand from households not yet ready to buy.
What this means for Temecula specifically:
- Temecula's entry-level price points run significantly below the statewide median, attracting buyers priced out of coastal markets
- Improving statewide affordability pushes demand further inland, benefiting Inland Empire and Southwest Riverside County markets
- Rising home prices support appreciation as a ROI driver even when cash flow margins are thin
Temecula vs. broader California benchmarks
Understanding where Temecula sits relative to statewide trends helps calibrate your return expectations more accurately. The 2026 market trends show clear patterns of inland market outperformance when coastal affordability tightens.
| Market indicator | California 2026 forecast | Temecula estimate |
|---|---|---|
| Median home price | $905,000 | $580,000–$650,000 |
| Price appreciation | +3.6% | +3.0%–4.5% |
| Cap rate range | 2.5%–3.5% (coastal avg.) | 3.2%–4.0% |
| Total ROI range | 5%–8% (coastal avg.) | 7%–11% |
| Sales volume change | +2% | +3%–5% (estimated) |
Temecula's pricing advantage over coastal Southern California markets means you get higher cap rates and more favorable cash-on-cash returns than markets like Los Angeles or Orange County. The macro drivers influencing ROI in Southern California consistently favor well-priced inland markets during periods of coastal unaffordability.
One factor often underweighted by new investors is the relationship between interest rates and real estate ROI timing. When rates are elevated, fewer people can afford to buy, which increases rental demand and supports rent levels. As rates eventually moderate, home prices tend to rise, boosting appreciation returns. In both scenarios, Temecula investors can find a favorable angle.
Key macro signals to watch in 2026:
- Federal Reserve rate decisions and their effect on 30-year fixed mortgage rates
- Temecula's continued population growth from coastal migration
- Local job market expansion in Southwest Riverside County's logistics and healthcare sectors
- New construction pipeline and its effect on rental supply
Understanding home value in SoCal is also important before making any purchase decision, since your entry price directly determines your cap rate and the appreciation leverage you'll experience over time.
Comparing property types and rental strategies: Long-term vs. short-term yields
Understanding the macro outlook, the next step is to compare key property types and rental strategies to identify the highest-yield scenarios.
Temecula has a genuinely interesting dynamic for rental investors. The wine country setting, proximity to Old Town Temecula, and weekend tourism draw create real short-term rental (STR) demand. But the suburban family-focused neighborhoods also generate steady long-term rental demand. Choosing the right strategy matters as much as choosing the right property.
Short-term rental performance in Temecula
The AirROI 2026 data for Temecula paints a specific picture of the STR market: average annual Airbnb revenue of $60,610, 35.3% occupancy, and a RevPAR (revenue per available rental) of $192, based on April 2025 to March 2026 data.
That $60,610 gross revenue sounds compelling, but the operative word is gross. Before you can compare it to a long-term rental, you need to subtract:
- Platform fees (typically 3% for hosts on major platforms)
- Property management fees (15%–25% of revenue for STR managers)
- Increased insurance costs
- Higher maintenance and turnover costs from frequent guest changes
- Seasonal vacancy (35.3% occupancy means 64.7% of nights are empty)
After those deductions, many STR operators in Temecula see net income that is only modestly higher than a well-priced long-term rental, with significantly more active management required.
Long-term rental benchmarks for Temecula
Long-term rentals in Temecula typically generate cap rates between 3.2% and 4.0%, with total ROI in the 7% to 11% range when appreciation and principal paydown are included. These properties require less day-to-day management, offer more predictable income, and carry lower operational costs.
| Strategy | Gross annual revenue | Estimated net yield | Management intensity | Seasonality risk |
|---|---|---|---|---|
| Short-term rental | $55,000–$65,000 | 4%–6% net | High | High |
| Long-term rental | $28,000–$40,000 | 3.5%–5% net (cash-on-cash) | Low | Very low |
| Total ROI (with appreciation) | N/A | 7%–11% both types | Varies | Lower for LTR |
You can also explore STR performance insights for other Southern California markets to benchmark Temecula against nearby alternatives.
Core considerations for choosing a rental strategy
- Regulatory environment: Temecula has specific short-term rental permit requirements and zoning restrictions. Verify compliance before purchasing any STR-intended property.
- Property location within Temecula: Wine country and Old Town adjacent properties favor STR. Suburban family neighborhoods favor long-term tenants.
- Your capital reserves: STRs require larger cash reserves for off-season periods and unexpected repairs. Long-term rentals are more forgiving for investors with tighter liquidity.
- Management bandwidth: Are you self-managing or using a property manager? STR management costs significantly reduce net yields.
- Investment horizon: If you plan to hold for 10 or more years, long-term rental total ROI often outperforms STR once you factor in compounding appreciation and principal paydown.
Pro Tip: Temecula's STR market shows strong seasonality peaking around wine harvest season and summer weekends. If you're modeling STR income, use the actual 35.3% occupancy benchmark, not the 60%–70% figures sometimes cited for top-performing listings. Using inflated occupancy assumptions is one of the most common ways investors overpay for a property.
Nuances and advanced ROI drivers: Appreciation, leverage, and principal paydown
Having compared rental strategies, let's take a closer look at the underlying drivers of ROI that separate average from exceptional investors in Temecula.
Most investors enter the Temecula market focused on a single question: does this property cash flow? While cash flow matters, it's only one layer of a multi-layered return structure. When you account for principal reduction and appreciation, the total return picture shifts dramatically.
Here's the core insight that most guides gloss over: when you borrow money to buy real estate, you're deploying leverage. That leverage multiplies your return on every dollar you personally invested. A 4% appreciation on a $600,000 property produces $24,000 in equity gain. If you put down $120,000 (20%), that $24,000 gain represents a 20% return on your actual cash invested, from appreciation alone, before you count rent collected, principal paydown, or tax benefits.
"Temecula's price levels can make rental yields relatively thin, so ROI may rely more on equity growth and principal paydown than on cash-on-cash alone. Separating total return from income return is critical for accurate investment evaluation." — Rental Property ROI insight
This distinction between total return and income return is the conceptual key to understanding why experienced investors continue to buy in markets like Temecula even when cash flow is modest.
Advanced ROI drivers beyond cash flow
Here are the factors that often determine which Temecula investors build real wealth versus which ones stall:
- Forced appreciation: Strategic renovations that increase property value and rental rate simultaneously boost both your equity and your income yield.
- Refinancing opportunities: As values rise and principal decreases, cash-out refinances allow you to extract equity and deploy it into additional properties, compounding your returns.
- Depreciation tax shield: Residential rental properties depreciate over 27.5 years for tax purposes, generating paper losses that offset ordinary income even when the property is cash-flow positive.
- 1031 exchanges: Selling an appreciated property and rolling the gains into a larger one defers capital gains taxes indefinitely, accelerating portfolio growth.
- Rent growth compounding: Long-term rentals that see 3%–5% annual rent increases compound significantly over a 10-year hold, turning modest initial cash flow into strong yield on cost.
- Market timing within Temecula: Different sub-markets within the city appreciate at different rates. Wine country parcels, school district premium zones, and new development corridors each carry distinct appreciation trajectories.
Understanding the difference between income return (cash flow and NOI) and total return (everything above combined) is what separates investors who build $1M in real estate equity from those who stay stuck at one property.
The overlooked reality: Why Temecula ROI depends on more than cash flow
Here's what most guides don't tell you about what actually works in Temecula.
After working with buyers and investors across Southern California, the pattern is clear: the investors who struggle in Temecula are almost always those who require strong positive cash flow on day one. They run the numbers, see a cap rate of 3.5%, and walk away from a property that would have returned 10% or more over five years when total return is calculated properly.
The investors who succeed are thinking in layers. They understand that investing in SoCal is rarely about maximizing initial yield. It's about acquiring appreciating assets in markets with structural housing shortages, using leverage responsibly, and allowing time to compound multiple return streams simultaneously.
Temecula sits in a genuinely advantaged position within Southern California. It's affordable enough that entry is possible for mid-tier investors, but established enough that it has consistent demand from both renters and buyers. The wine country identity gives it tourism revenue potential that generic suburban Inland Empire markets don't have. And its continued population growth from coastal migration creates a durable demand floor under home prices.
The uncomfortable truth about Temecula cash flow: in most scenarios, you will not see strong monthly cash flow in the first two to three years of ownership. A $600,000 property financed at current rates will likely be near cash-flow neutral after accounting for all expenses. That reality turns off a lot of investors who then park their capital in places with lower appreciation potential. What they miss is that "cash-flow neutral plus 4% appreciation plus principal paydown" is a genuinely strong annual return, often outperforming what those same investors could generate elsewhere.
The most sophisticated angle here is exit strategy. Investors who bought in Temecula five to seven years ago and planned their exit from day one, whether through sale, 1031 exchange, or cash-out refinance, are now sitting on substantial equity that far exceeds what any high-yield savings account or stock position would have produced in the same period. ROI isn't just a formula. It's a function of time, leverage, and market selection. Temecula, understood correctly, checks all three boxes.
Find your next high-ROI Temecula property with expert local guidance
With all the pieces in place, here's your next step to maximize your returns in Temecula real estate.
Understanding ROI frameworks is valuable, but applying them to actual properties requires current market data, local sub-market knowledge, and the ability to evaluate deals quickly in a competitive environment.

At INC Realtors, we specialize in helping buyers and investors find properties that align with their specific ROI goals, whether that's building long-term equity in a single-family home or positioning for short-term rental income with a well-located condo in Temecula. Our market insight tools and personalized approach mean you're never evaluating a deal in isolation. You're working with an expert who knows local cap rate benchmarks, rental demand patterns, and appreciation history by neighborhood. Ready to apply what you've learned? Browse current Temecula listings and connect with our team for a personalized ROI analysis on any property that catches your attention.
Frequently asked questions
What is a good ROI for real estate in Temecula?
A typical ROI benchmark for Temecula ranges from 7% to 11% when total return is calculated, which includes appreciation and principal paydown alongside cash flow, with cap rates falling between 3.2% and 4.0%.
Are short-term rentals better for ROI in Temecula than traditional rentals?
Short-term rentals can generate higher gross revenue, with average annual revenue of $60,610 at 35.3% occupancy, but higher operating costs, management intensity, and seasonal variability mean net returns often land close to long-term rental yields.
How do home price trends in California affect Temecula ROI?
Statewide appreciation sets the backdrop for Temecula's equity growth assumptions, and the C.A.R. 2026 forecast projects a 3.6% median price increase with improving affordability, which reinforces demand and price floors in Temecula's relative value market.
What factors should I include when calculating real estate ROI?
A complete picture requires all four components: cash flow after expenses, property appreciation, principal paydown from mortgage amortization, and tax benefits such as depreciation deductions and interest write-offs, with financing terms affecting each component differently.