

TL;DR:
- Local market trends in Southern California determine property values and investment outcomes more accurately than national data. Neighborhood-level analysis reveals whether a specific area favors buyers or sellers at any given time.
Local market trends are defined as the measurable shifts in supply, demand, pricing, and buyer behavior within a specific geographic area. In Southern California real estate, these trends determine property values and investment timing far more directly than national headlines ever could. The role of local market trends is especially pronounced in a region as economically diverse as Los Angeles, Orange County, and San Diego, where a single zip code can behave completely differently from the county surrounding it. Increaltors tracks these neighborhood-level signals daily to help homebuyers and investors cut through the noise and act on real data. Understanding these trends is not optional. It is the foundation of every sound real estate decision in this market.
What factors shape local market trends and property values?
Local market dynamics in Southern California are driven by a specific set of measurable forces. Inventory levels, mortgage rates, employment diversity, and buyer competition each push prices up or down in ways that national data simply cannot capture.
Housing inventory and buyer demand
Inventory is the single most immediate force on home prices. When listings are scarce and buyers are competing, sellers hold the advantage and prices climb. Housing inventory is projected to increase by 10% in 2026 across Southern California. That increase gives buyers more options and gradually shifts negotiating power away from sellers.

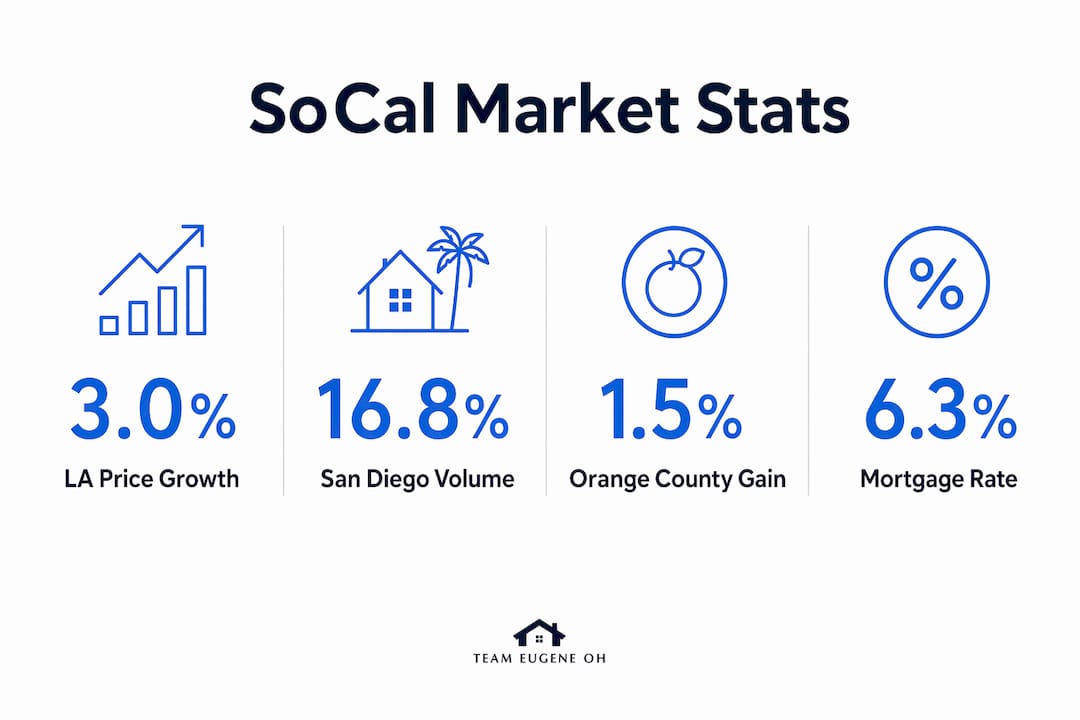
Mortgage rates shape affordability directly. 30-year fixed rates reached approximately 6.30% in april 2026. At that level, a $900,000 loan carries a monthly principal and interest payment near $5,600, which prices out a meaningful share of buyers and softens demand in mid-tier neighborhoods.
Employment sectors and buyer pool stability
Employment diversity is a structural advantage for Southern California. LA County's diversified economy spans entertainment, aerospace, federally funded research and development, healthcare, manufacturing, and tourism. That breadth means no single industry downturn collapses the entire buyer pool, which keeps prices more stable than in single-industry metros.
Orange County draws heavily from finance, biotech, and defense contractors. San Diego's buyer pool leans on the military, life sciences, and higher education. Each employment base creates a different income profile, which explains why median prices and sales volumes diverge so sharply across county lines.
County-level price and volume comparison
The table below shows how divergent local market behavior can be, even within the same region.
| County | Average sold price change (YoY) | Sales volume change (YoY) |
|---|---|---|
| Los Angeles | +3.0% | Moderate growth |
| Orange County | +1.5% | Stable |
| San Diego | -3.1% | +16.8% |
May 2026 data shows LA prices rising 3.0% year over year while San Diego prices fell 3.1% despite a 16.8% surge in sales volume. That combination tells a specific story: San Diego buyers are active, but they are paying less per transaction, which signals a shift in the mix of homes selling rather than a market collapse.
Pro Tip: Watch both price and volume together. A market where prices fall but volume rises is correcting, not crashing. That distinction changes your offer strategy entirely.
How do you conduct local market analysis for smarter decisions?
Local market analysis is the process of reading neighborhood-level data to identify whether a specific area favors buyers or sellers at a given moment. The industry uses two primary frameworks: Comparative Market Analysis and full Market Analysis.
CMA versus full market analysis
A Comparative Market Analysis identifies the right price for a specific property based on recent comparable sales. A full Market Analysis evaluates the supply and demand temperature of an entire neighborhood to inform entry timing for buyers and investors. Both tools serve distinct purposes. Using only a CMA tells you what a home is worth today. Adding a full Market Analysis tells you whether today is the right moment to buy in that area.
Key signals to monitor
Neighborhood-level signals like listing velocity, buyer competition, and local fundamentals predict opportunity more accurately than regional or national averages. Track these specific data points when analyzing any Southern California neighborhood:
- Days on market (DOM): Falling DOM signals rising demand. Rising DOM signals softening.
- Sale-to-list price ratio: Ratios above 100% mean buyers are overbidding. Ratios below 98% mean sellers are accepting cuts.
- Price reduction frequency: A high share of listings with price cuts signals oversupply or overpricing.
- Listing velocity: How fast new inventory appears and disappears reveals true buyer appetite.
- School ratings and district boundaries: School quality directly affects resale value and buyer pool depth.
- Local employer proximity: Homes near major employers in aerospace, healthcare, or tech attract more qualified buyers.
Each of these signals tells a different part of the same story. No single metric is enough. The pattern across all of them reveals the real trend.
Pro Tip: Track multiple adjacent neighborhoods by monitoring one neighborhood slightly below your budget and one slightly above. The price gap between them reveals where momentum is building and where you have the most negotiating room.
Increaltors provides updated market snapshots that pull these signals together for Los Angeles, Orange County, and surrounding areas. Using real-time data rather than month-old reports makes a measurable difference in offer timing.
What regional nuances in Southern California should you watch?
Southern California is not one market. It is dozens of micro-markets stacked inside three major counties, each with its own employment base, price behavior, and buyer psychology.
Los Angeles: price growth with neighborhood variation
Los Angeles posted 3.0% year-over-year price growth in may 2026. That number masks enormous variation at the neighborhood level. The Los Angeles residential market shows that areas near major studios, hospitals, and universities hold value more consistently than neighborhoods dependent on a single retail corridor. Micro-climates, school boundaries, and even street-level conditions influence value in ways that a county-wide average cannot show.
Experienced investors in LA look at factors like whether a block sits inside a top-rated school district boundary, how close it is to a freeway without being on it, and whether the immediate street has owner-occupied or rental-dominated housing. These details move prices by tens of thousands of dollars within a quarter mile.
Orange County: steady demand, limited supply
Orange County's 1.5% price gain reflects a market where demand stays consistent but inventory remains tight. The county's employment base in finance, biotech, and defense creates a buyer pool with strong income stability. That stability keeps prices from falling sharply even when mortgage rates rise. Buyers in Orange County compete in a market where well-priced homes in good school districts rarely sit for more than two weeks.
San Diego: volume up, prices adjusting
San Diego's combination of falling prices and rising volume is the most interesting signal in the region right now. The 16.8% volume increase suggests buyers are returning to the market, but they are targeting more affordable price points. The military, life sciences, and university sectors provide a durable employment floor, which limits how far prices can fall before demand absorbs the inventory.
| County | Key employment sectors | Market behavior in 2026 |
|---|---|---|
| Los Angeles | Entertainment, aerospace, healthcare, R&D | Prices up 3.0% YoY, strong neighborhood variation |
| Orange County | Finance, biotech, defense | Prices up 1.5% YoY, tight inventory |
| San Diego | Military, life sciences, education | Prices down 3.1% YoY, volume up 16.8% |
Pro Tip: Never evaluate a Southern California property using county-level data alone. Pull the data for the specific zip code and the two zip codes adjacent to it. That three-zip comparison reveals whether you are buying into a rising pocket or a lagging one.
For a broader view of where the top investment locations are emerging across the region, Increaltors publishes neighborhood-level analysis updated for 2026 conditions.
How does understanding market trends benefit buyers and investors?
Trend knowledge converts directly into better decisions at every stage of a real estate transaction. The impact of market trends shows up in offer strategy, negotiation leverage, and long-term investment returns.
Inventory shifts and negotiation leverage
Rising inventory gives buyers real power. When a neighborhood carries 60 days of supply instead of 20, sellers become more willing to accept contingencies, cover closing costs, or negotiate on price. Buyers who track inventory trends know when that window opens. Buyers who rely on gut feel often miss it.
Institutional investors account for only 1–2% of California single-family home sales. The real competition comes from other owner-occupants with similar budgets and timelines. That fact changes how you think about competing. You are not fighting a well-capitalized institution. You are competing with a neighbor who wants the same school district.
Avoiding common pitfalls
The following behaviors separate buyers who use trend data well from those who do not:
Common pitfalls:
- Waiting indefinitely for rates to drop before buying
- Treating a county-wide price average as a neighborhood-level fact
- Ignoring days on market when evaluating whether a listing is fairly priced
- Overweighting national economic news against local supply and demand signals
Strategic behaviors:
- Setting real-time listing alerts for target neighborhoods
- Reviewing sale-to-list ratios before making an offer
- Consulting a local agent who tracks micro-market data weekly
- Prioritizing lifestyle fit and financial capacity alongside market timing
Timing the market is consistently less effective than buying a property that fits your lifestyle and financial situation today. Waiting for a perfect rate environment while prices rise in your target neighborhood often costs more than the rate difference would have saved.
Pro Tip: Set up listing alerts for your target neighborhood and the two adjacent ones. When you see a well-priced home appear and disappear in under a week, that is a live signal that demand in that pocket is stronger than the broader market suggests.
For context on why investing in SoCal still makes sense despite rate headwinds, Increaltors has published a detailed breakdown of the 2026 investment case.
Key Takeaways
Local market trends in Southern California determine property values and investment outcomes more precisely than any national indicator, making neighborhood-level analysis the most reliable tool for buyers and investors in 2026.
| Point | Details |
|---|---|
| Inventory drives negotiation power | A 10% inventory increase in 2026 gives buyers more options and more room to negotiate terms. |
| County trends diverge sharply | LA prices rose 3.0% YoY while San Diego fell 3.1% YoY, proving county-level data matters more than regional averages. |
| Employment sectors anchor demand | LA's diversified economy across entertainment, aerospace, and healthcare keeps its buyer pool stable through economic shifts. |
| CMA and market analysis serve different purposes | Use a CMA to price a property and a full Market Analysis to decide whether now is the right time to enter a neighborhood. |
| Lifestyle fit beats market timing | Buying a home that matches your financial capacity and lifestyle today outperforms waiting for a theoretically perfect rate environment. |
What I've learned about reading the SoCal market without getting burned
The Southern California market has a way of humbling people who think they can time it perfectly. I have worked with buyers who waited 18 months for rates to drop, only to watch the neighborhoods they wanted move further out of reach. The market did not wait for them, and it rarely does.
What I have found consistently is that the buyers who do best are the ones who focus on neighborhood fundamentals rather than national headlines. A Federal Reserve announcement moves mortgage rates, but it does not change whether a specific block in Pasadena or Irvine has strong schools, short commutes, and owner-occupied housing. Those fundamentals hold value through rate cycles.
The San Diego data from 2026 is a good example of why surface-level reading misleads people. Prices are down 3.1%, and a lot of buyers read that as a warning sign. But volume is up 16.8%. That means buyers are active and transacting. The price shift reflects a change in what is selling, not a collapse in confidence. Knowing the difference between those two things is what separates a good decision from a reactive one.
My advice to every buyer and investor I work with is the same: get the data for your specific target neighborhood, compare it to the two adjacent neighborhoods, and then make your decision based on what the local signals actually say. National news is background noise. Local data is the signal.
— Irvin Nierras
Southern California homes worth acting on right now

Increaltors covers the Los Angeles, Orange County, and surrounding Southern California markets with current listings and neighborhood-level market data. Whether you are looking for a single-family home in an established neighborhood, a condo near a major employment hub, or vacant land for development, the listings are updated regularly to reflect current market conditions. Irvin Nierras provides personalized guidance on offer strategy, neighborhood selection, and investment timing based on the same local market analysis covered in this article. Browse all available listings and connect with Increaltors to put current market data to work for your next real estate decision.
FAQ
What is the role of local market trends in real estate?
Local market trends define the balance of supply and demand in a specific area, directly setting property values and determining whether buyers or sellers hold the advantage. They are more predictive than national or regional averages for any individual transaction.
How do mortgage rates affect Southern California home prices?
Higher mortgage rates reduce the pool of qualified buyers, which softens demand and slows price growth. At approximately 6.30% in april 2026, 30-year fixed rates have made affordability a central factor in Southern California purchasing decisions.
Why do Los Angeles, Orange County, and San Diego behave differently?
Each county has a distinct employment base, income profile, and inventory level that produces different price and volume outcomes. In may 2026, LA prices rose 3.0% while San Diego prices fell 3.1% despite a 16.8% increase in sales volume.
What is a Comparative Market Analysis and when should I use it?
A CMA identifies the right price for a specific property based on recent comparable sales. Use it when you need to know what a home is worth. Use a full Market Analysis when you need to know whether now is the right time to buy in a given neighborhood.
Should I wait for lower interest rates before buying in Southern California?
Waiting for lower rates is consistently less effective than buying a property that fits your lifestyle and financial capacity today. Prices in target neighborhoods often rise faster than the savings a lower rate would provide.