
The average Los Angeles multifamily cap rate stood at 5.37% in Q2 2026, with stabilized mid-tier assets typically pricing in the 4.5% to 5.5% range. That headline number hides a wide spread. Submarket location and rent-control status can push a deal several points off that average.
- Market average: roughly 5.37% across LA County
- Westside low end: near 4.0% to 4.5% on stabilized Class A/B assets
- South LA high end: up to 7.5% on value-add, rent-controlled buildings
Key Takeaways
| Point | Details |
|---|---|
| Market average | LA multifamily cap rates average about 5.37% as of Q2 2026. |
| Submarket spread matters most | Westside deals trade near 4.0% to 4.75% while South LA value-add can exceed 7.5%. |
| RSO creates two-tier pricing | Loss-to-lease drives buyers to accept lower current caps for future rent-reset upside. |
| Verify NOI before trusting the cap rate | Pull trailing financials and stress vacancy assumptions before underwriting. |
| Get local deal support | Increaltors offers deal sourcing, underwriting support, and valuation help for LA multifamily investors. |
Table of Contents
- Current Los Angeles Real Estate Cap Rates: Where the Market Stands
- How Do You Calculate a Cap Rate?
- Cap Rates by Submarket and Building Class
- How Does Rent Control Affect Cap Rates in Los Angeles?
- What's Driving Cap Rate Movement in Los Angeles Right Now?
- How Should Investors Use Cap Rates When Underwriting a Deal?
- Common Mistakes and Red Flags in LA Cap Rate Analysis
- How Do Market Reports Calculate These Cap Rates?
- A Local Broker's View on LA Cap Rates
- Get Local Help Evaluating a Los Angeles Multifamily Deal
- Frequently Asked Questions
- Sources
Current Los Angeles Real Estate Cap Rates: Where the Market Stands
Los Angeles property investment activity in mid-2026 reflects a market that has settled after two years of repricing. The 5.37% average cap rate Matthews reported for Q2 2026 came alongside price-per-unit data, vacancy readings, and rent-growth figures that together sketch a market still adjusting to elevated debt costs. The Group CRE's H1 2026 report put executed-deal averages closer to 5.6% to 5.8% in some data sets, a gap worth noting when you're comparing two reports side by side.
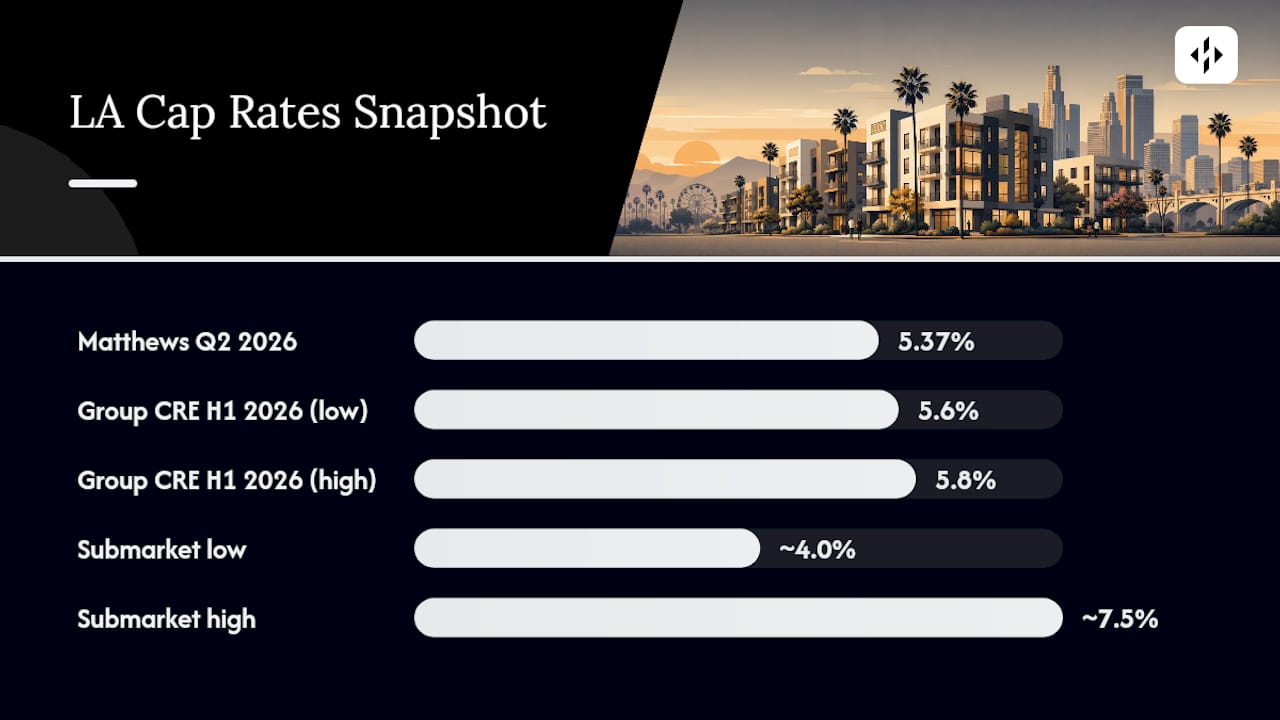
Year-over-year movement has been modest rather than dramatic. Cap rates crept up from their 2021 lows but haven't spiked further in recent quarters, suggesting the market found a rough equilibrium.
| Metric | Q2 2026 Reading |
|---|---|
| Average cap rate | 5.37% |
| Submarket range | ~4.0% to 7.5% |
| Trend vs. prior year | Modest upward drift, flattening |
- Vacancy and rent growth vary sharply by submarket, not just cap rate
- Price per unit tracks inversely with cap rate across most LA neighborhoods
- Executed-deal samples from different reports rarely match exactly
How Do You Calculate a Cap Rate?
A cap rate is net operating income divided by purchase price. That's the whole formula, and every other conversation about "current cap rates in LA" builds on it.
Say a 12-unit building in Mid-City generates $420,000 in effective gross income, with $150,000 in operating expenses. NOI comes to $270,000.
What market reports typically fold into NOI:
- Effective gross income after a vacancy credit, not gross potential rent
- Normalized operating expenses (property tax reassessed at sale price, not seller's historical tax bill)
- Excludes debt service, capital expenditures, and depreciation entirely
Cap Rates by Submarket and Building Class
Analyzing LA cap rates requires breaking the county into pieces, because a countywide average tells you almost nothing about what you'll actually pay for a specific building. Westside submarkets like Santa Monica and West LA trade tightest, often 4.0% to 4.5%, because tenant demand and rent ceilings are high even under rent control. Koreatown and Central LA sit in the middle, generally 5.0% to 6.0%. South LA, where value-add opportunities and heavier deferred maintenance are common, can push past 7.0%.
- Westside (Class A/B, 20+ units): 4.0% to 4.75%
- Koreatown/Central LA (Class B, 10 to 19 units): 5.0% to 6.0%
- DTLA Class A (elevated vacancy): 5.5% to 6.5%
- South LA (Class C, value-add): 6.5% to 7.5%
- South Bay (Class B, 5 to 9 units): 5.0% to 5.75%
- San Fernando Valley (mixed class): 4.75% to 5.75%
| Submarket | Building Class | Typical Cap Rate | RSO Status Impact |
|---|---|---|---|
| Westside | A/B | about 4% to about 5% | Rent control limits upside, but rents already near ceiling |
| Koreatown/Central | B | roughly 5% to 6% | High loss-to-lease, wide two-tier spread |
| South LA | C | about 6.5% to 7.5% | Deferred maintenance plus rent-reset uncertainty |
Smaller buildings, 2 to 4 units, often trade on a price-per-unit basis rather than a clean cap rate, since owner-users skew the comparable pool.
How Does Rent Control Affect Cap Rates in Los Angeles?
The Los Angeles Rent Stabilization Ordinance and statewide AB 1482 cap annual rent increases and restrict how owners recover costs through surcharges. The 2026 RSO rewrite tightened those caps further, narrowing the paths landlords have to raise NOI on covered buildings.
This regulatory reality creates what brokers call a two-tier valuation. A building with tenants paying well below market rent carries large loss-to-lease, meaning current income understates the property's real earning potential. Buyers price that gap into the deal, sometimes accepting a lower current cap rate because they're really buying future rent-reset upside once units turn over.
- Loss-to-lease of 30% to 40% is common in older RSO buildings in Koreatown and East Hollywood
- Vacancy decontrol, not annual increase caps, is what actually resets rent to market
- Turnover timelines under RSO are unpredictable and often slower than pro forma models assume
Pro Tip: Model RSO buildings with a conservative turnover schedule, five to seven years for full unit reset, rather than assuming the whole rent roll normalizes in year two.
What's Driving Cap Rate Movement in Los Angeles Right Now?
Higher-for-longer interest rates remain the dominant force. Lenders underwriting deals today assume elevated debt costs persist rather than reverting quickly, which keeps required returns, and cap rates, from compressing back toward 2021 levels.
Local supply and demand add texture to that macro story. ADU ordinance changes from LA County have added incremental unit supply in select neighborhoods, while population trends tracked by the Census Bureau continue to support underlying rental demand across the county.
- Interest rate path and DSCR-driven lender underwriting
- New supply completions concentrated in specific submarkets, not evenly distributed
- Regulatory tightening on RSO-covered inventory reducing achievable NOI growth
SCAG's regional economic analysis points to employment and household formation trends that continue to underpin demand even as financing costs stay elevated.
How Should Investors Use Cap Rates When Underwriting a Deal?
A cap rate is a starting point, not a verdict. Here's how to actually put one to work.
- Verify NOI quality by pulling trailing twelve-month financials, not the seller's pro forma projection.
- Check the rent-to-market ratio unit by unit to estimate real loss-to-lease.
- Stress vacancy assumptions against the submarket's actual vacancy rate, not a citywide figure.
- Run the deal at two or three cap rate scenarios to see how purchase price and required equity shift.
- Confirm DSCR coverage against current lender minimums before finalizing an offer.
On identical NOI of $270,000, a 5.0% cap rate implies a $5.4 million price; a 6.0% cap implies $4.5 million. That $900,000 swing changes the entire capital stack.
Pro Tip: Most LA multifamily lenders want DSCR of 1.20 to 1.25 or better at today's rates, so a cap rate that looks attractive on paper can still fail to finance.
Common Mistakes and Red Flags in LA Cap Rate Analysis
Treating a headline cap rate as a real yield, without adjusting for below-market rents, is the single most frequent underwriting error investors make in this market. Deferred maintenance and inflated management-expense assumptions distort the picture further.
- Undocumented income streams that don't match bank deposits or leases
- Unresolved code violations that could trigger forced capital expenditures
- High loss-to-lease paired with no realistic rent-reset timeline
If you spot any of these, demand full rent rolls and commission a scope-of-work inspection before moving forward.
How Do Market Reports Calculate These Cap Rates?
Reports differ on whether they use reported NOI or pro forma projections, and whether their sample includes only closed transactions. Small submarket sample sizes and recording lags on sales explain most discrepancies between two published averages.
- Compare whether each report uses transacted or listed cap rates
- Check the unit-count filter; small-batch owner-user sales skew results
A Local Broker's View on LA Cap Rates
We've watched cap rates stabilize after two volatile years, and the buildings moving fastest right now are the ones where sellers price in loss-to-lease honestly instead of marketing headline yield. Irvin Nierras has spent years underwriting LA and Orange County multifamily deals, and our team offers local deal analysis for investors weighing a specific submarket or asset.
Get Local Help Evaluating a Los Angeles Multifamily Deal
Increaltors gives investors something most cap-rate spreadsheets can't: a local team that has walked the actual buildings behind these submarket numbers. Instead of guessing at loss-to-lease from a distance, you get deal sourcing, underwriting support, and valuation help grounded in current LA transaction data.

Our services for multifamily investors include:
- Deal sourcing across Westside, Central LA, South Bay, and Valley submarkets
- Underwriting support to stress-test NOI, loss-to-lease, and DSCR before you make an offer
- Buyer and seller representation through closing, backed by local RSO and AB 1482 knowledge
If you're weighing a specific property, start with a free home valuation or browse current listings to see what's active in your target submarket right now.
Frequently Asked Questions
What is the average cap rate in Los Angeles right now? The Los Angeles multifamily average sat at roughly 5.37% in Q2 2026, though submarket and asset class push individual deals well above or below that figure.
What is a good cap rate for investment properties in Los Angeles? Stabilized mid-tier assets typically land in the 4.5% to 5.5% range. A "good" cap rate depends on your return targets, financing terms, and whether the deal has value-add upside.
Why do cap rates vary so much between LA submarkets? Rent control status, building class, deferred maintenance, and loss-to-lease all shift where a property lands in the range, sometimes by three points or more between the Westside and South LA.
How does rent control affect cap rates in Los Angeles? RSO and AB 1482 limit annual rent increases, which caps how fast NOI can grow on covered buildings and creates a two-tier value structure between current income and future market-rate potential.
Where can I find current LA multifamily cap rate data? Quarterly reports from Matthews and The Group CRE, along with local brokerage market snapshots, are the most reliable sources for current commercial real estate cap rates in LA.
This article is general information, not a substitute for advice from a qualified financial advisor. Consult a qualified financial professional about your own circumstances before acting on anything here.