

TL;DR:
- The average days on market in Long Beach is about 45 to 47 days in May 2026, faster than the national median of 52 days. This quick turnover indicates strong buyer demand and a seller's market driven by tight inventory and competitive pricing.
The average days on market in Long Beach sits at 45–47 days as of may 2026, which is faster than the national median of 52 days. In real estate, "days on market" (DOM) measures the time from a property's listing date to the date a buyer's offer is accepted. That is distinct from the full transaction timeline, which adds financing, inspection, and closing periods on top. Long Beach's sub-50-day pace signals strong buyer demand and a seller's market that rewards well-priced homes. Whether you are buying or selling in this city, understanding what drives that number gives you a real edge.
What is the average days on market in Long Beach right now?
The median home in Long Beach spent 47 days on the market as of may 2026, down from 50 days in may 2025. That one-year improvement shows the market is absorbing listings faster, not slower, even as more homes become available. A separate data set from MarketPulse puts the average at 45 days, with inventory sitting at just 0.9 months of supply. Less than one month of inventory is extremely tight. It means buyers have very few homes to choose from, which keeps competition high and listing times short.

The Altos Research market report adds an important layer. Active Long Beach listings show an average of 59 days but a median of only 35 days. That gap exists because a small number of overpriced or poorly conditioned homes sit for months and pull the average up. The median is the more useful number for most buyers and sellers. It tells you what a typical, well-positioned home actually experiences.
Pro Tip: When you see a DOM figure quoted, ask whether it is the median or the average. The median gives you a cleaner read on typical market speed because it is not distorted by outliers.
How has Long Beach's listing time changed over recent years?
Long Beach's property sales duration has tightened meaningfully over the past 12 months. The drop from 50 days in may 2025 to 47 days in may 2026 reflects a market that is moving faster despite modest price softening. The median sale price stands at $707,200, a slight dip from recent peaks, yet homes are selling more quickly. Lower prices are attracting buyers who were previously priced out, which accelerates absorption.
The Altos Research Market Action Index for Long Beach registers at 49, a reading that places the city firmly in "Strong Seller's Market" territory. That classification holds even as 36% of active listings show price reductions. Price cuts on overpriced homes are not a sign of weakness. They are a correction that brings those homes back into the competitive range and moves them off the market faster.
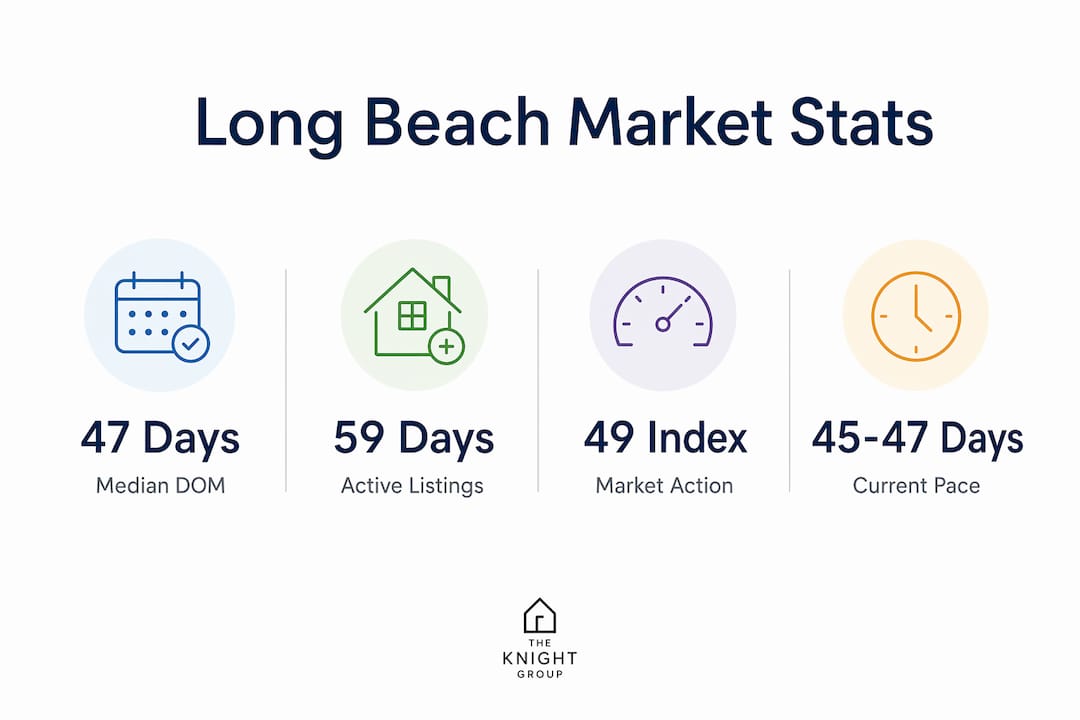
The table below summarizes the key data points across sources for may 2026.
| Metric | Value | Source |
|---|---|---|
| Median days on market | 47 days | Realtor.com |
| Average days on market | 45 days | MarketPulse |
| Active listing average DOM | 59 days | Altos Research |
| Active listing median DOM | 35 days | Altos Research |
| Months of inventory | 0.9 months | MarketPulse |
| Market Action Index | 49 (Strong Seller's) | Altos Research |
| Median sale price | $707,200 | MarketPulse |
Pro Tip: Track the Market Action Index monthly, not just sale prices. It reacts faster to shifts in supply and demand and gives you an earlier signal of where the market is heading.
What factors influence average days on market in Long Beach?
Pricing is the single biggest driver of how long a home sits. Well-priced Long Beach properties sell faster than national averages because active buyer demand rewards competitive listings immediately. A home priced 5–10% above comparable sales will often sit for weeks before the seller accepts a reduction, adding unnecessary days to the count. That delay costs sellers negotiating leverage and signals weakness to buyers.
Beyond price, several other factors shape how quickly a home moves.
- Property condition. Homes that are move-in ready attract more showings and faster offers. Deferred maintenance, dated kitchens, or visible repairs push buyers toward better-conditioned alternatives.
- Location within Long Beach. Neighborhoods like Belmont Shore, Naples, and Bixby Knolls carry strong demand year-round. Properties in less sought-after corridors take longer regardless of price.
- Inventory levels. At 0.9 months of supply, Long Beach buyers have limited choices. Low inventory compresses DOM because buyers act quickly when a good home appears.
- Buyer financing readiness. Pre-approved buyers close faster. Sellers who accept offers from buyers without pre-approval add risk and often extend the total transaction timeline.
- Seasonal demand. Spring and early summer consistently produce the fastest sales in Southern California. Listings that enter the market in january or february often wait longer for the buyer pool to deepen.
The DOM metric itself varies by data source and methodology. Some sources measure listing-to-pending, others measure listing-to-closing. Buyers care most about listing-to-pending because it tells them how fast they need to act. Sellers care about listing-to-closing because that is when they receive proceeds. Knowing which definition a report uses changes how you interpret the number.
Pro Tip: Ask your agent which DOM definition their data uses before drawing conclusions. A 47-day median from listing-to-pending is very different from a 47-day median that includes the closing period.
Inventory increases do not automatically slow the market. An increase in local inventory does not necessarily mean the market slows. Pricing remains the key factor in Long Beach's selling speed. When new listings enter at realistic prices, they sell quickly and the overall DOM stays low. The homes that inflate the average are the ones priced above what the market will bear.
How does Long Beach compare to other Southern California markets?
Long Beach's homes market days compare favorably across the Southern California region. Long Beach often shows faster sales than many comparable SoCal cities, driven by its active local demand and relatively accessible price points within the Los Angeles metro area. The city benefits from a diverse buyer pool that includes first-time buyers, investors, and move-up buyers relocating from higher-cost areas.
The table below places Long Beach in regional context using available 2026 data.
| Market | Typical DOM range | Market character |
|---|---|---|
| Long Beach | 45–47 days (median) | Strong Seller's Market |
| Los Angeles city | Generally longer | Varies widely by submarket |
| Orange County | Competitive, often similar | High price points slow some segments |
| National median | 52 days | Slower than Long Beach |
Los Angeles as a whole shows longer average listing times across many submarkets because its price range is wider and luxury inventory sits longer. Orange County carries higher median prices, which narrows the buyer pool in certain segments and extends DOM for homes above $1.5 million. Long Beach sits in a price range that attracts consistent demand without the extreme price sensitivity of luxury markets.
The Market Action Index is a more immediate indicator of seller advantage than historical price trends. Long Beach's index of 49 outperforms many neighboring cities, which means sellers in Long Beach face less competition from other listings and buyers face more urgency. That dynamic directly compresses the time a well-priced home spends on the market.
For buyers considering Long Beach versus other SoCal options, the shorter DOM means less time to deliberate. Homes that fit your criteria will not wait. Understanding the regional market differences between Long Beach and surrounding cities helps you calibrate your search timeline and offer strategy.
What strategies work best given Long Beach's current market pace?
The 45-day average listing time in Long Beach requires both buyers and sellers to operate with a clear plan. Vague timelines and reactive decisions cost money on both sides of the transaction.
For sellers
- Price at or just below comparable sales. Homes priced competitively generate multiple offers within the first two weeks. Overpricing by even 3–5% can push your listing past the 59-day average for active listings, which signals to buyers that something is wrong.
- Stage before you list. Professional staging reduces perceived days on market by generating faster offers. Buyers form opinions within seconds of viewing photos online. A staged home photographs better and attracts more showings.
- Respond to offers within 24 hours. Slow responses give buyers time to reconsider or find another property. In a market where the median DOM is 35 days for active listings, hesitation from sellers is a red flag.
- Understand the full closing timeline. Sellers should differentiate between days on market and total time to closing. Financing, appraisals, and inspections add 30–45 days after contract acceptance. Budget for that gap in your moving plans.
- Disclose proactively. Surprises during inspection extend timelines and kill deals. Full disclosure upfront keeps the transaction on schedule.
For buyers
- Get fully pre-approved before you search. Pre-approval, not just pre-qualification, tells sellers you are a serious buyer. In a market where homes move in under 47 days, sellers will not wait for a buyer who is still gathering documents.
- Set alerts for new listings in your target neighborhoods. Homes in Belmont Shore or Bixby Knolls can receive offers within days of listing. Waiting until the weekend to tour a home listed on tuesday means you may already be too late.
- Understand what a longer DOM signals. A home sitting at 70 or 80 days in a 47-day market is telling you something. Either the price is too high, the condition is poor, or there is a disclosure issue. Use that information to negotiate, not to assume you found a hidden gem.
- Build your team before you need them. Have your inspector, lender, and agent ready to move fast. A 10-day inspection contingency is standard, but your ability to close on time depends on how quickly your team can execute.
- Make clean offers. In a seller's market with a Market Action Index of 49, contingency-heavy offers lose to cleaner ones. Work with your agent to identify which contingencies are truly necessary and which ones you can waive safely.
Key takeaways
Long Beach's average days on market of 45–47 days reflects a strong seller's market driven by tight inventory, active buyer demand, and competitive pricing.
| Point | Details |
|---|---|
| Current DOM benchmark | Long Beach median is 47 days, faster than the national median of 52 days. |
| Median vs. average matters | The 35-day active listing median is more useful than the 59-day average, which is skewed by outliers. |
| Pricing drives speed | Homes priced at market value sell within the typical window; overpriced homes inflate the average. |
| Inventory stays tight | At 0.9 months of supply, buyers face real urgency and sellers hold negotiating leverage. |
| Know your full timeline | DOM ends at contract acceptance; closing adds another 30–45 days for financing and inspections. |
What I've learned from watching Long Beach's market timing up close
The most common mistake I see from both buyers and sellers is treating the days on market number as a simple scoreboard. It is not. It is a signal that requires interpretation.
Sellers often come to me frustrated that their home has been sitting for 60 days when the "market average" is 47. What they do not realize is that the 47-day figure applies to homes that were priced correctly from day one. Their home was priced 8% above comparable sales, and the market told them so within two weeks. By the time they reduced the price, the listing had accumulated enough days to make buyers suspicious. That suspicion costs them more in final sale price than the original reduction would have.
Buyers make the opposite mistake. They see a home at 65 days on market and assume it is a bargain waiting to happen. Sometimes it is. But in Long Beach's current market, a long DOM more often means a condition problem or a seller who is not yet realistic about price. I always pull the price history before advising a client to pursue a stale listing.
The 2026 market differs from 2023 and 2024 in one important way. Prices have softened slightly, but the Market Action Index has not dropped. That combination tells me buyers are getting marginally better deals on price while still competing for the same limited inventory. It is a narrow window of opportunity for buyers who are ready to act. Sellers who price correctly are still getting strong results. The market has not shifted in favor of buyers. It has simply become slightly more rational.
My advice: stop watching the DOM number in isolation. Watch it alongside inventory levels, the Market Action Index, and price reduction rates. Those three together give you a complete picture of where Long Beach real estate is actually heading.
— Irvin Nierras
Increaltors can help you read the Long Beach market
Knowing the average listing time in Long Beach is one thing. Knowing how to act on it is another.

Increaltors specializes in Long Beach and the broader Southern California market, with current listings across single-family homes, condominiums, and vacant land. Whether you are a seller who wants a precise pricing strategy or a buyer who needs to move fast in a 47-day market, Increaltors provides the local data and hands-on guidance to keep you ahead. Get a free home valuation to see where your property stands in today's market, or browse the full Long Beach listings to find your next home before someone else does.
FAQ
What is the average days on market in Long Beach in 2026?
The average days on market in Long Beach is approximately 45–47 days as of may 2026. This is faster than the national median of 52 days, reflecting strong local buyer demand and tight inventory of just 0.9 months.
What is the difference between median and average days on market?
The median days on market removes the distortion caused by outlier listings that sit for months. In Long Beach, the active listing median is 35 days while the average is 59 days, making the median a more accurate measure of typical market speed.
Does a high days on market number mean a home is overpriced?
A DOM significantly above the local median often signals overpricing, poor condition, or an undisclosed issue. In Long Beach's current market, homes priced at comparable sales levels routinely go under contract within the 35–47 day window.
How does Long Beach's DOM compare to Los Angeles and Orange County?
Long Beach generally sells faster than many Los Angeles submarkets and competes closely with Orange County, where higher price points slow certain segments. Long Beach's Market Action Index of 49 places it firmly in seller's market territory relative to the broader region.
Does days on market include the closing period?
No. Days on market measures the time from listing to contract acceptance, not the full closing timeline. Financing, appraisals, and inspections add roughly 30–45 days after the contract is signed, which is why sellers need to plan beyond the DOM figure alone.